|
Brief Description
Pupils' reactions to a number of optical illusions give a
rough measure of the power of each illusion using ordinal scales.
Three of the illusions are followed up in detail. Optional
sections include the magnitude of the deception measured on
interval and ratio scales, and the differences between nominal,
ordinal, interval and ratio scales.
Design time: 4-5 hours.
Aims and Objectives
On completion of this unit pupils should be able to calculate
a mode for discrete ordinal and discrete interval data. They will
have practised calculating the median and the mean of a frequency
distribution on discretc data, using the mode, median and mean as
representative measures: collecting and recording data in tables
and bar charts and interpreting this data.
Those who complete the optional sections are introduced to a
simple use of change of origin; the differences between nominal,
ordinal, interval and ratio scales; and which of the mean, median
and mode is appropriate for each scale.
Prerequisites
Pupils will need to be able to read a scale to the nearest 2
millimetres, carry out simple multiplication of decimals, divide
by the number of pupils in thc class, correct to one place of
decimals and (for those who do C6) add and multiply
positive and negative numbers to one decimal place. Those who do
Section D will need to be able to read flow charts. It
will help if pupil~ have previously drawn simple bar charts, but
they can refer to examples ia the text for help. The method of
finding the median as the value assigned tc the middle item in a
small ordered set of items should be known.
Equipment and Planning
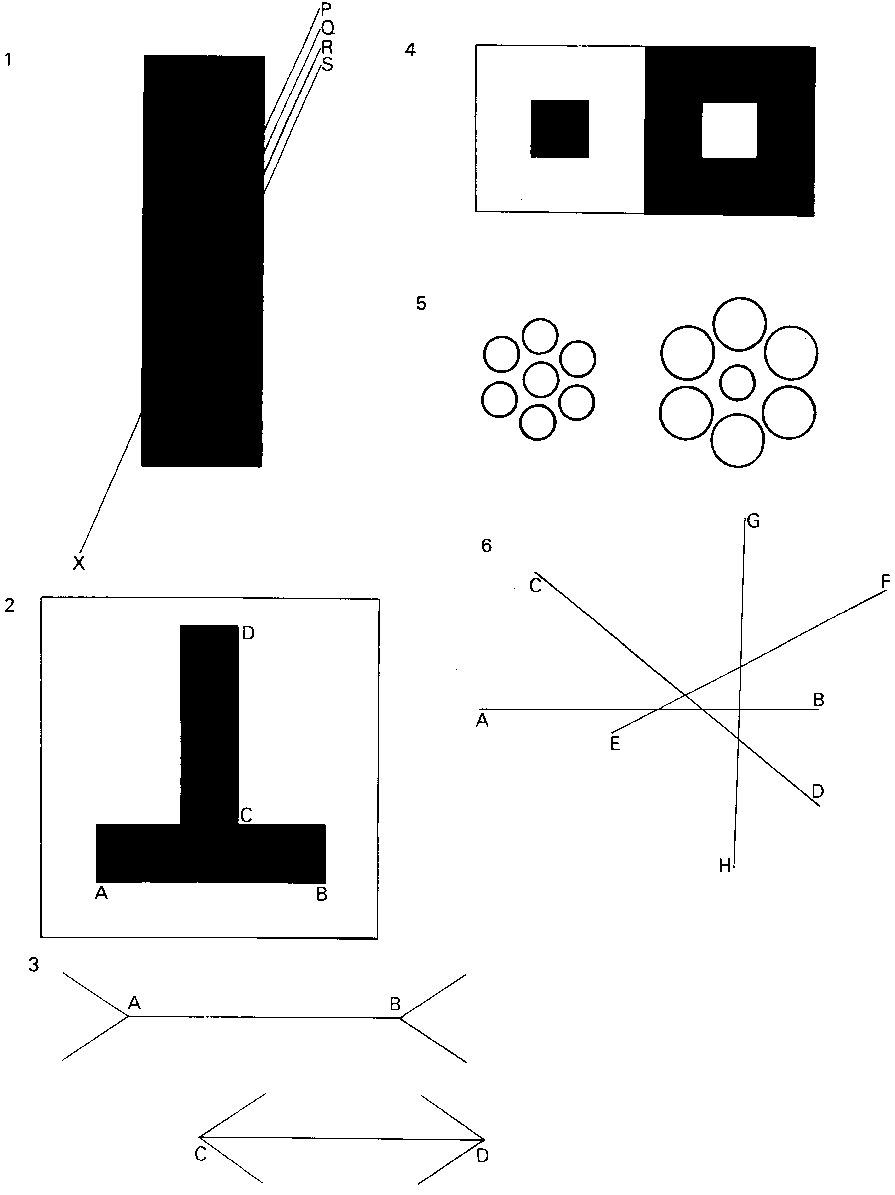
The illusions are on page Rl and questions about them on page
R2. The questions can be answered on page R2 or on a separate
piece of paper. Class results can be entered in the tables on
page R3.
Illusion 7 is not given on the page of illusions, since it
depends on surprise and little study time. You will need to
prepare it yourself either by drawing it on a large piece of
paper, on the back of a roller blackboard (make sure it does not
come round upside down) or on an overhead transparency. It is
shown here. Take care to space the words out as shown.
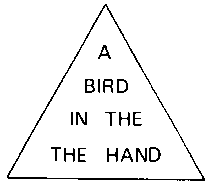
Blank tables are given on sheet R3 for use with Sections B1
and C. Squared paper or graph paper will be needed for
the bar charts. Calculators may be found useful in Sections C4
and C6.
Section C needs some simple apparatus made out of
card, as follows. Allow yourself one hour to make this apparatus.
Experiment 1
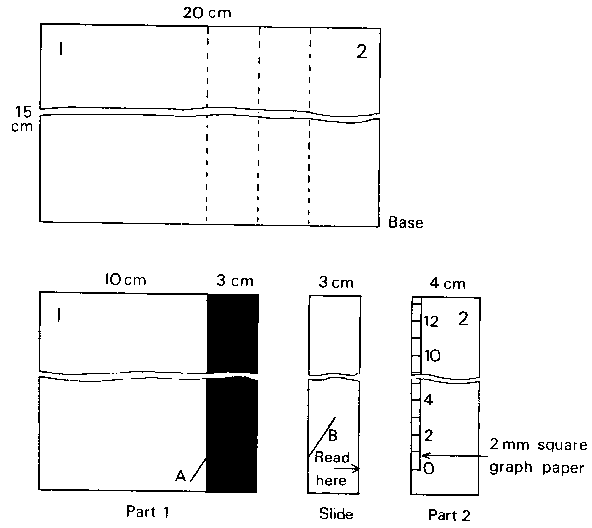
The two part lines A and B must be parallel.
Stick parts 1 and 2 on the base. The arrow on the slide, marked 'Read
here', lines up with the scale on the 2mm square graph paper.
This scale should be marked and numbered in centimetres. Zero on
the scale should be opposite the arrow on the slide when the
slide has not been moved. The part lines A and B
should be at about 30o with the vertical.
Experiment 2
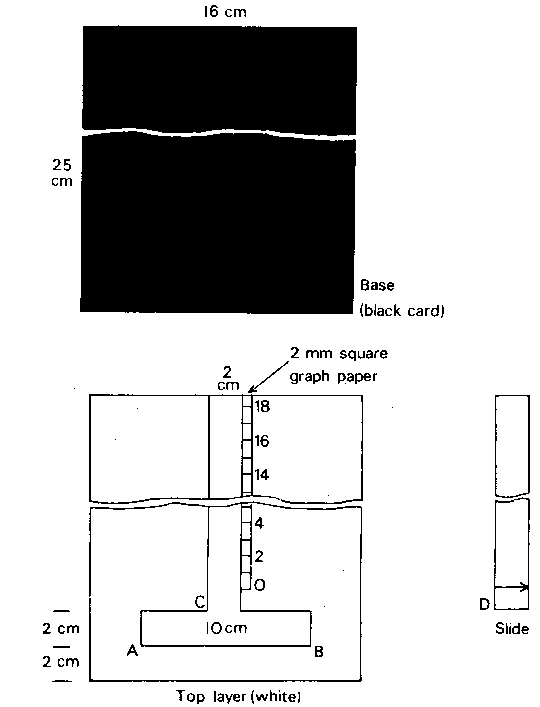
Cut out the T-shaped hole. Stick the squared paper scale into
the position shown. Stick the top layer on the base. The arrow on
the slide should point to zero when C is level with D.
Experiment 3
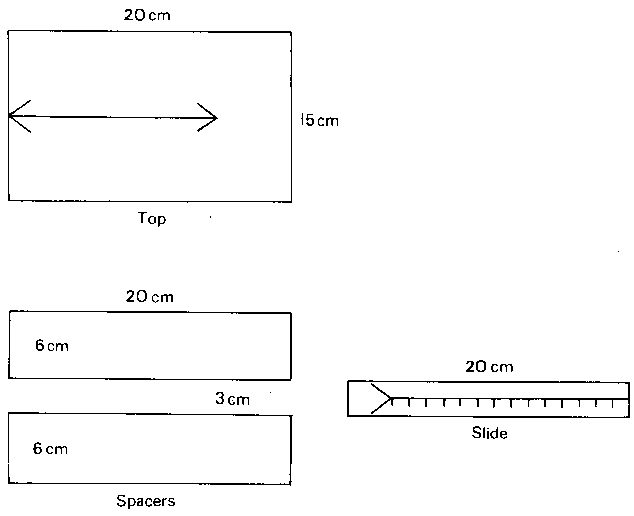
Glue the spacers underneath the top, leaving room for the
slide to fit between them. Mark the scale on the slide faintly in
centimetres, subdivided into 2 mm intervals. Make sure the line
and the arrow markings are bold. The model can be made more
sturdy by including another 20 x 15 cm piece of card as a base.
Underlying the whole unit are two themes. One relates to the
four types of scale - nominal, ordinal, interval and ratio - and
the differences between them. These are brought out explicitly in
optional Section D, but are implicit in the core work in
which pupils work with both ordinal and interval scales. The
second theme is increased sophistication in measurement,
illustrated by the power of optical illusions. The first measure
is based on the number of pupils with the right answer. The
second approach measures the amount of error in the class answers.
Section A introduces the idea of optical illusions.
Section B tests seven illusions and does a simple
analysis using modes and medians on ordinal scales. Section C
looks quantitatively at three of the illusions, using an interval
scale as a more refined measure. Section D makes more
explicit the differences between the four different types of
scale. Optional Sections B7 and C4b are
to reinforce techniques of calculation. They can be omitted by
brighter pupils. Other optional sections (C3, C6
and D) are more difficult and need only be done by
brighter pupils.
Detailed Notes
Section A
This section sets the scene for the later optical illusions.
There is no 'correct' answer to the first two drawings. The wrong
lines are joined in the two-pronged fork, giving the impression
of three rods. It may be useful to extend the discussion slightly
to discuss accuracy of scientific observation with problems of
colour, measurement and parallax.
Section B
B1
It is advisable to outline the procedure to the pupils
before showing them the two pages of illusions and questions. It
is very important to stress that the aim is to test not the
pupils, but the illusions. They should write down what appears
to be the correct answer at first sight. Do all that you can to
discourage cheating. An element of surprise is needed in illusion
7, which is described under 'Equipment and Planning'.
The correct answers are 1d, 2c,
3a, 4b, 5b, 6b,
and 7 'A bird in the the hand (note the repeated
'the').
Predrawn tables on the blackboard are a convenient way to
collect the class results quickly. With an even number of pupils
in the class, add in your own results to make an odd number. This
will help in Section B6.
B2
Pupils can work on question a while the class results of
B1b are being collected. Here a simple measure
of a successful illusion is used. The most successful illusion is
the one that fools most people. We can thus use the class results
to measure, for this particular class, which is the most
successful illusion. It is the one with the fewest correct
answers. This rough-and-ready measure of an illusion's success
can be compared and contrasted with the more refined methods in
Section C later.
B3
The mode is the particular answer given by more pupils
than any other answer. This is not necessarily the correct answer.
B4
An ordinal scale is one which has an order inherent in
the nature of the variable. In the illusions there are variables
based on positions on a line (illusion 1), lengths of lines (illusion
6) and on size (illusions 2 to5). These all give ordinal scales.
It would not be appropriate to use alphabetical order in illusion
6 and call this an ordinal scale, since the assigning of letters
to the lines is essentially arbitrary and the question asked one
to consider the lengths of the lines. With an ordinal scale more
information is retained when keeping this order in tabulation and
in drawing bar charts (B5). It would generally be
considered incorrect not to put the variable on the horizontal
axis in one of the two proper orders.
B6
Calculating the median involves putting the pupils in
order. So medians can only be defined when the data are measured
on at least an ordinal scale. The formula 'look at the value of
the 1/2(n + 1)th pupil' is hinted at in the
pupil notes. You can make this more explicit if you wish. The
only problem arises when n is even and the two middle
pupils disagree. For example, if n = 34, and the 17th
pupil says 'line GH' and the 18th pupil says 'line CD',
then there is no median. It is to avoid this problem that we
suggest you make sure there is an odd number of answers to the
illusions (by incorporating your own answers if necessary). The
more general problem is then treated in C2. In cases
where the ordinal scale is numerical, then conventionally the
median is defined as the mean of the answers of the two middle
pupils. But this can be misleading, and the convention is more
useful with interval and ratio scales.
Reinforcement work on the median may well be needed here (and
perhaps also for C2).
*B7
Further imaginary results for another class are included
here for reinforcement, if thought necessary.
Two useful textbook references are:
- Modern Mathematics for Schools by Scottish
Mathematics Group, Book 4, pages 214-220, (Blackie/Chambers,
1973)
- School Mathematics Project Book C, pages 149-161
(Cambridge University Press, 1970)
With brighter pupils you might like to take the opportunity of
pointing out the difference between NOMINAL and ORDINAL scales.
This is followed up in Section D. A nominal scale has no
underlying order. For example, in 'Favourite sports' there is no
reason to prefer the order (soccer, cricket, tennis) to (tennis,
soccer cricket). In an ordinal scale there is an underlying order.
In illusion 6 the lines EF, AB, GH and
CD had lengths 5.5, 6.0, 6.2 and 6.5 cm, respectively.
They were ordered by length, and the question was about length,
so we have an ordinal scale. But the difference between EF
and AB (0.5 cm) is not of the same magnitude as the
difference between AB and GH (0.2 cm). An
ordinal scale just shows the order, it does not have equal
differences between successive values of the variables.
Section C
C1
The three experiments are refined versions of the
illusions numbered 1 to 3. By using an interval scale measured in
millimetres we can assess the degree of bias imparted by each
illusion.. You will need to do some initial experimenting with
your own models to find the appropriate figures to insert in the
first columns of the tables on page R2. The experiments can be
done while the class is completing Section B. One way of
collecting the class results is to have the children enter their
results in blank tables on the blackboard. These can then be
copied by the pupils on to the R2 pages for future use.
Each pupil should do each experiment as it is passed round the
class.
The problem with class intervals is avoided in the text, and
can be similarly avoided in class. Otherwise, any problem can be
overcome by (i) reducing the size of the model, or (ii) marking
the scale:
 or whatever is
appropriate or whatever is
appropriate
in effect doing the class interval work for the pupils.
C2
The experimental results are measured on an interval
scale (see notes under C5). An interval scale is ordered,
so we can calculate medians as well as modes. As it stands, the
first direct reference to the correct answers is in C5.
You may wish to give them at this stage; they will be needed
eventually. The method of measuring (to the nearest 2 mm) has
effectively changed a continuous variable to a discrete variable,
so the calculation of the median follows the same pattern as in
Section B. If you think pupils do not need the practice,
each pupil need do question c for only one of
the experiments. You can arrange so that each experiment is
analysed by a third of the pupils and the answers given to the
other pupils for later use.
*C3
This optional section provides histograms of the results,
although the term is not used in the pupil notes.
C4
With an interval scale we can find a mean as well as a
median. The method described here leads to the later use of the
formula:

Multiplication is shown as a quicker way of carrying out the
required additions. Less able pupils may well require help here.
Question c shows why it is not possible to get a
mean for ordinal data. Clearly (1 x 'line P') + (9 x 'line Q'),
etc., has no meaning. A common, but wrong, method is to give the
numbers l, 2, 3 ... to ordinal data and use these to calculate a
mean.
Reinforcement work may be needed here. For examples see School
Mathernatics Project, Book F, pages 72-74, and most recent
mathematics textbooks.
C5
This section attempts to compare the power of each
illusion by means of the magnitude of the bias or error induced
in the class results. The median and mean are taken as being 'representative'
of the class. Each pupil needs to know the correct answers and
class means and medians for the three experiments.
In Sections C1 to C5 all the measurements
are on an interval scale. Section C6 moves on to a ratio
scale. This is followed up in Section D but can be
anticipated here if it helps brighter pupils. The answers 11.6 cm,
11.8 cm, etc., were all in centimetres. An interval of one
centimetre from 11 to 12 is of exactly the same length as that
from 12 to 13. An ordered scale with equal intervals is called an
INTERVAL SCALE. But a reading of 0 cm does not mean that there is
no error. A reading of 12 cm is closer than a reading of 2 cm,
but it is not six times as good. In our experiment 12 cm is below
the correct answer by 0.4 cm; 2 cm is below the correct answer by
10.4 cm. So in this case 2 cm is 26 times as bad as 12 cm. In an
interval scale the zero does not mean 'nothing', and we cannot
compare results by multiplication.
However, in this case and in many others, we can get these
extra properties by a simple change of origin. This is done in
Section C6 by measuring errors from the correct position.
In this case 0 does mean no error, and an error of 2 cm
is twice the error of 1 cm. We now have a RATIO SCALE. From data
measured on interval and ratio scales we can calculate means as
well as medians and modes. All this information is summarized in
the flow chart in Section D.
For pupils who are not proceeding to Section D it is
useful to summarize the main points made about calculating modes,
medians and means with examples. The mode can always be
calculated (although it is not always unique). The median can be
calculated only when the scale is ordered, and hence not for
nominal scales. The mean can only be calculated when there is at
least an interval scale.
*C6
This optional section is especially for those who are to
do Section D. It could also be done by older pupils too,
if so desired.
The allocation of the signs + and to errors above and below
the correct answer is arbritary. It is appropriate to attach
signs to the errors here since a mean o f zero would mean that
the illusion had no overall effect on the class. This would not
show up if all the errors were treated as positive. Pupils may
need help in working out the  .
It is probably easiest to add all the negative part totals,
separately add all the positive part totals, and then combine
these two totals to get the final answer. A convenient method is
to use two columns. .
It is probably easiest to add all the negative part totals,
separately add all the positive part totals, and then combine
these two totals to get the final answer. A convenient method is
to use two columns.
*Section D
This optional section makes more explicit the differences
between nominal, ordinal, interval and ratio scales. The notes
under Sections B4, B6 and C5 are
relevant here. The use of nominal, ordinal, interval and ratio
scales cuts across the more usual discrete / continuous dichotomy.
The following table gives examples:
| |
Nominal |
Ordinal |
Interval |
Ratio |
| Discrete |
Favourite pet |
Position in family, youngest to oldest |
Adult shoe sizes (British system) |
Number of peas in a pod |
| Continuous |
- |
IQ measurements |
Time on 24 hour clock (unless midnight is a genuine
zero) |
Weight |
Answers
| A |
a |
Either two black faces or a vase. |
| |
b |
Most people see 9, some see 10. |
| |
c |
Most people see 10; those who saw 10 in
b should now see 9. |
| |
d |
There appear to be 3 at the left, but
only 2 at the right. |
| |
|
|
| B2 |
|
The correct answers are: |
| |
|
1 d, 2 c, 3 a, 4 b, 5 b, 6 b and 7 'A
bird in the the hand'. |
| |
|
|
| B4 |
b |
P,Q,R,S (or S,R,Q,P) |
| |
c |
Illusions 2 and 3: AB is shorter than CD;
AB and CD are the same length; AB is longer than CD (or
the reverse order)
Illusions 4 and 5: Answer a, answer b, answer c (or the
reverse order) |
| |
|
|
| B5 |
a |
Figure 2 |
| |
b |
Figure 2 |
| |
c |
It makes it easier to answer questions
like a and b. It shows the distribution more clearly. |
| |
|
|
| B7 |
a |
Line CD |
| |
b |
Class 2Z |
| |
|
|
| C2 |
a |
11.8 cm |
| |
|
|
| C4 |
a |
See detailed notes. |
| |
|
|
| D |
a |
'Favourite games' is on a nominal scale. |
| |
b |
Could be correct. |
| |
c |
'Bed times' is on an interval scale. |
| |
d |
Median number of goals must be a whole
number (or possibly ending in 0.5 if an even number of
matches). |
| |
e |
Could be correct. |
| |
f |
Could be correct. |
| |
g |
Four is the middle pupil, not the median. |
| |
h |
Nominal |
| |
j |
Interval |
| |
k |
Nominal |
| |
i |
Ratio |
| |
m |
Ratio |
| |
n |
Ratio |
| |
p |
Interval |
| |
q |
Interval |
| |
r |
Nominal |
| |
s |
Ratio |
| |
t |
Ratio |
| |
u |
Interval |
Test Questions
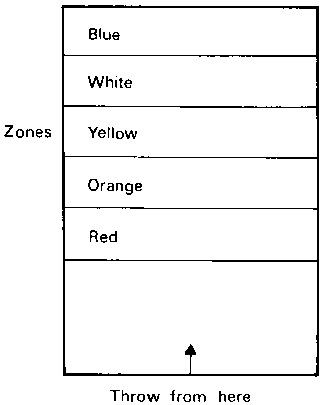
- 25 children were playing in a field with a cricket ball
to see who could throw it the greatest distance. The
field was marked in coloured zones. Red was nearest, blue
furthest away. Their results are shown in Table l.
| Zone |
Number of children |
| Blue |
1 |
| Qrange |
8 |
| Red |
5 |
| White |
2 |
| Yellow |
9 |
Table 1 - Class results
- How many balls landed in the zone nearest the
start line?
- The order of zones in Table 1 is not the best to
use. Why?
- Rewrite Table 1 with the zones in a better order.
- Find the median zone.
- Table 2 shows the results obtained by a class of 29
pupils, who carried out the experiment to make the bars
of the T the same length. The correct answer is 10.0 cm.
| Length in cm |
Number of
pupils |
| 9.2 |
4 |
| 9.4 |
8 |
| 9.6 |
7 |
| 9.8 |
5 |
| 10.0 |
3 |
| 10.2 |
2 |
| Total |
29 |
Table 2
- How many pupils had the right answer?
- The mode and median can be used to represent the
class answers. What else can be used?
- What is the mode of their answers?
- Copy and complete Table 3.
| Length
in cm |
Number
of pupils |
Pupils
numbered |
| 9.2 |
4 |
1 to 4 |
| 9.4 |
8 |
5 to __ |
| 9.6 |
7 |
__ to __ |
| 9.8 |
5 |
__ to __ |
| 10.0 |
3 |
__ to __ |
| 10.2 |
2 |
__ to 29 |
Table 3
- What is the number of the 'middle' pupil? Find
the median length of their answers.
- Use the median to measure the class error. (Correct
length 10.0 cm)
| Length
in cm |
Number
of pupils |
Part
totals |
| 9.2 |
4 |
36.8 |
| 9.4 |
8 |
|
| 9.6 |
7 |
67.2 |
| 9.8 |
5 |
49.0 |
| 10.0 |
3 |
|
| 10.2 |
2 |
|
| Total |
26 |
|
Table 4
- Copy and complete Table 4.
- Find the mean length of the answers.
Questions 3 and 4 are for those who completed Section D.
- *What is wrong with each of these statements?
- Our class wrote down their favourite pets. The
median was the cat.
- Our class lined up in order of height. The mode
height was Jim Brown.
- I arrived home from school at 4 o'clock. Jane
arrived home at 8 o'clock. We should have arrived
at 3.30 pm. She was twice as late as I was.
- The mean subject in our class is English.
- *For each of the following, do you have a nominal,
ordinal, interval or ratio scale? (Use the flow chart to
help you.)
- High jump heights
- Favourite football teams
- Weights of pupils in your class
- Time you arrive at school each morning
Answers
| 1 |
a |
5 |
| |
b |
Not in order of distance from the 'throw' line |
| |
c |
Table rewritten with order R, 0, Y, W, B or B, W, Y,
0, R |
| |
d |
Orange (zone of the 13th pupil) |
| |
|
|
| 2 |
a |
3 |
| |
b |
The mean |
| |
c |
9.4cm |
| |
d |
Complete third column: 1 to 4, 5 to 12, 13 to 19, 20
to 24, 25 to 27, 28 to 29 |
| |
e |
Pupil number 15. Median length is 9.6 cm |
| |
f |
(Median) class error is 10.0 9.6 = 0.4 cm. |
| |
g |
Third column should read 36.8, 75.2, 67.2, 49.0, 30.0,
20.4. Total is 278.6. |
| |
h |
Mean length is 278.6/29cm = 9.61
cm (9.6 to 1 decimal place) |
| |
|
|
| 3* |
a |
'Pets' is nominal scale. No median with nominal scale. |
| |
b |
Mode could be Jim's height not Jim. |
| |
c |
'Time' is interval scale. Twice as late implies ratio
scale. Actually nine times as late when measured from 3.30
on a ratio scale. |
| |
d |
Can't have mean with nominal scale. |
| |
|
|
| 4* |
a |
Ratio |
| |
b |
Nominal |
| |
c |
Ratio |
| |
d |
Interval |
Connections with Other Published Units from the Project
Other Units at the Same Level (Level 2)
Authors Anonymous
On the Ball
Opinion Matters
Getting it Right
Fair Play
Units at Other Levels in the Same or Allied Areas of the Currlculum
Level 1
Practice makes Perfect
If at first...
Shaking a Six
Level 3
Net Catch
Cutting it Fine
Multiplying People
Phoney Figures
Level 4
Smoking and Health
This unit is particularly relevant to: Science, Mathematics.
Interconnections between Concepts and Techniques Used In these Units
These are detailed in the following table. The code number in
the left-hand column refers to the items spelled out in more
detail in Chapter 5 of Teaching Statistics 11-16.
An item mentioned under Statistical Prerequisites
needs to be covered before this unit is taught. Units which
introduce this idea or technique are listed alongside.
An item mentioned under Idea or Technique Used is not
specifically introduced or necessarily pointed out as such in the
unit. There may be one or more specific examples of a more
general concept. No previous experience is necessary with these
items before teaching the unit, but more practice can be obtained
before or afterwatds by using the other units listed in the two
columns alongside.
An item mentioned under Idea or Technique Introduced
occurs specifically in the unit and, if a technique, there will
be specific detailed instruction for carrying it out. Further
practice and reinforcement can be carried out by using the other
units listed alongside.
| Code No. |
Statistical Prerequisites |
Introduced in |
| 3.1b |
Median for discrete data, small n |
Shaking a Six
Phoney Figures |
| |
Idea or Technique Used |
Introduced in |
Also Used in |
| 2.1a |
Constructing single variable frequency tables |
If at first...
Authors Anonymous
Opinion Matters |
Multiplying People |
| 2.2a |
Bar charts |
Shaking a Six
Authors Anonymous |
Cutting it Fine |
| 5a |
Reading tables |
Shaking a Six
If at first...
Authors Anonymous
Net Catch
Phoney Figures |
On the Ball
Multiplying People
Opinion Matters |
| 5b |
Reading bar charts |
Phoney Figures
Smoking and Health |
Cutting it Fine |
| 5i |
Estimating population figures from samples |
Getting it Right
Net Catch
Multiplying People
Smoking and Health |
Fair Play |
| 5v |
Inference from tables |
On the Ball
Net Catch
Multiplying People
Phoney Figures
Smoking and Health |
Shaking a Six
Cutting it Fine
Net Catch |
| |
Idea or Technique Introduced |
Also Used in |
| 1.2a |
Using discrete data |
Shaking a Six
Authors Anonymous
Getting it Right
Multiplying People
If at first...
Fair Play
Net Catch
Phoney Figures
Tidy Tables
Opinion Matters
Cutting it Fine |
| l.2b |
Using continuous data |
Practice makes Perfect
Getting it Right
Cutting it Fine |
| 1.2d |
Different types of data |
|
| 2.2e |
Bar chart for continuous data |
Practice makes Perfect
Authors Anonymous |
| 3.1a |
Mode for discrete data |
Shaking a Six
Phoney Figures
Seeing is Believing
Authors Anonymous |
| 3.1c |
Mean for small data set |
Practice makes Perfect
On the Ball
Net Catch
Smoking and Health
If at first...
Fair Play
Cutting it Fine
Authors Anonymous
Getting it Right
Phoney Figures |
| 3.1f |
Mean for frequency distribution |
Authors Anonymous
Fair Play
Cutting it Fine |
| 3.1h |
Median from cumulative frequencies (discrete data) |
|
Page R1
Page R2
Illusion Answers
Tick the answer you think is correct. Do not use a ruler to
help you;
- The line X goes behind the black rectangle and comes out
the other side. Which line is it?
- line P
- line Q
- line R
- line S
- Which is true?
- AB is shorter than CD.
- AB and CD are the same length.
- AB is longer than CD.
- Ignore the arrowheads. Which is true?
- AB is shorter than CD.
- AB and CD are the same length.
- AB is longer than CD.
- Look at the two small squares. Which is true?
- The black square is smaller than the white square.
- The two squares are the same size.
- The black square is larger than the white square.
- Look at the two centre circles. Which is true?
- The circle at the left is smaller than the circle
on the right.
- The two circles are the same size.
- The circle on the left is larger than the circle
on the right.
- Which line is longest?
- AB
- CD
- EF
- GH
- The words in the triangle were:
Page R3
Section B1 : Class Results
Table 1 and 6
Table 2, 3, 4, and 5
| |
Number of pupils |
| Right |
|
| Wrong |
|
Table 7
Section C: Individual Results
Experiment 1 ____ cm
Expreiment 2 ____ cm
Experiment 3 ____ cm
Class Results
| Reading |
Number of pupils |
Part totals |
| |
|
|
| |
|
|
| |
|
|
| |
|
|
| Total |
|
|
Experiment 1, 2, and 3
|